How do I read the concept map?
What each mark and line on the concept map means, what you see when you select a concept or a connection, how to move around the map, and how to read the map as a list.
What does the concept map show?
The concept map is the large figure at the top of the report, under the heading "Page concepts & recommended coverage". It shows the concepts that the analysis found on your page, the concepts that it proposes to add, and the connections between them.
The line under the heading counts them, for example "12 mapped concepts · 3 proposed additions · 2 presence checks". The presence checks part shows only when some concepts have a "?" mark (see below).
The next line says how to read the map: "Read left to right. Position is not importance. Select a concept to see all its connections." The main topic is the dark label at the left. One line joins each other concept to the nearest concept that a recorded relationship connects it to. The place of a concept on the map does not show how important it is. A lighter band groups a concept next to the main topic with the concepts that sit beside it.
When nothing is selected, the map draws one line for each concept except the main topic and the unconnected concepts. A concept can have more connections than that line. Select a concept: the map then draws every connection of that concept, outlines the concepts at the other end and shows the other concept names in grey. The lines have no arrows. The detail lists each connection with its direction, for example "Cache → Latency", and the relationship words under it.
A concept that no recorded relationship connects to the main topic shows at the bottom of the map, under a line with the words "Not connected to the main topic".
When nothing is selected, the panel beside or below the map shows the page overview. Select a concept or a connection to see its detail in that panel. Select "Page overview" to go back. On a narrow screen, a card between the map heading and the map names the selection, with "Read evidence ↓" and "Page overview". On a phone, when the map is out of view, a bar at the bottom of the screen names the selection, with "Show on map ↑".
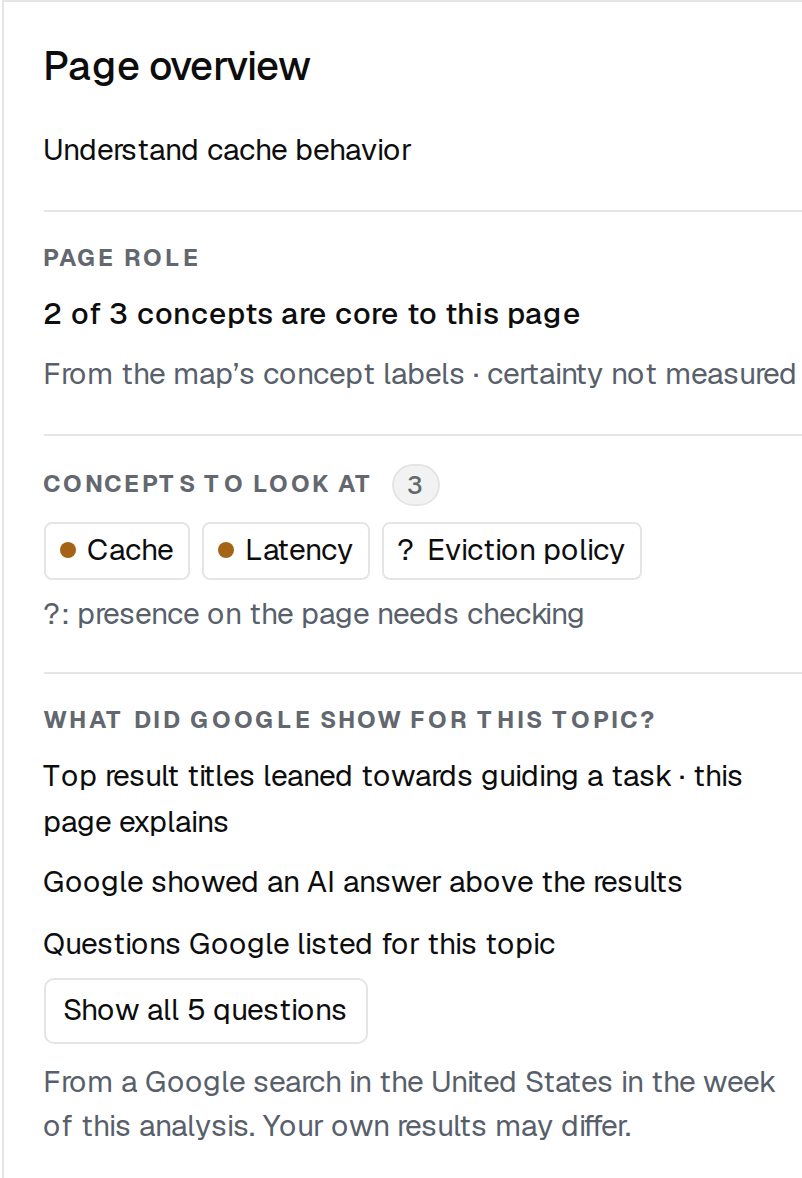
When nothing is selected, the page overview shows the reader goal and three parts: "Page role", with how many concepts are core to this page; "Concepts to look at", with a button for each concept that needs attention, is a proposed addition or needs a presence check; and "What did Google show for this topic?". Select a concept button to open its detail.
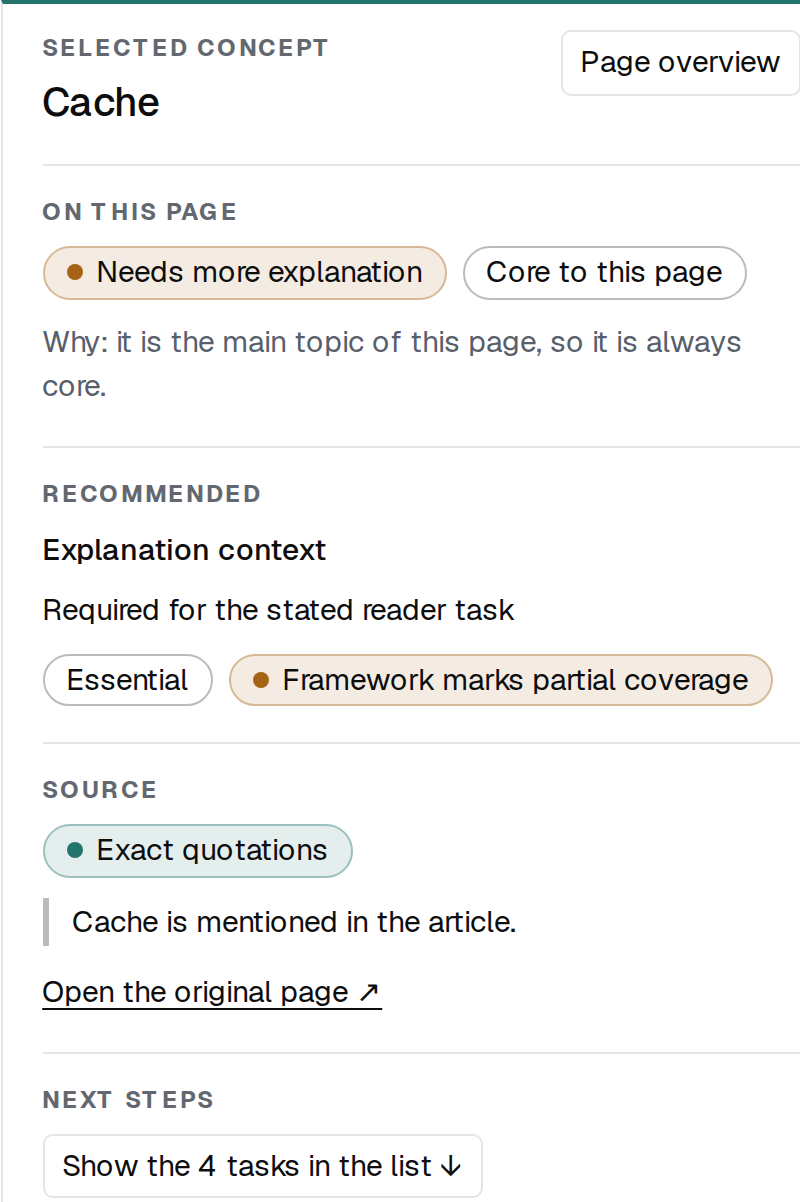
On a phone, when a concept is selected, the button under the map reads "Show the 2 tasks in the list ↓" and goes to that concept’s first task.
What do the marks on the map mean?
The legend under the map names most marks. Each concept shows as its name with a mark before it.
A concept with a "?" mark needs a presence check: the analysis records disagree about whether the page has the concept, or they could not be matched to one concept. For example, the concept map finds the concept, but the explanation framework marks it absent. Select the concept to read the reason under "On this page". The map heading counts these concepts as presence checks, and the page overview lists them under "Concepts to look at" with a "?" mark. Check the page itself before you act on such a concept. For the four labels of how well the page explains a concept, see Coverage Score.
| Mark | Legend label | What it means |
|---|---|---|
| Filled dot | Well integrated | The page names the concept consistently, explains it in enough depth and connects it to related concepts. |
| Amber diamond | Needs attention | The page has the concept, but it is lightly explained, needs more explanation, or its naming varies. |
| Dashed outline | Proposed addition | The explanation framework proposes this concept, and the analysis did not find it on the page. |
| Solid line | (not in the legend) | At least one relationship that the analysis found on the page connects the two concepts. Select the line, or one of its concepts, to read each relationship and its direction in the detail. |
| Dashed line | Suggested connection | A relationship that the explanation framework suggests. The page does not state it. |
| "?" on a concept | (not in the legend) | The presence of the concept needs checking (see above). |
| Number on a concept | Number = linked tasks | The count of next steps linked to the concept. A screen reader reads it with the concept name, for example "Inspect Cache, 3 linked tasks". |
What do I see when I select a concept or a connection?
A selected concept shows five parts. "On this page" says how well the page explains the concept, gives its boundary classification, and gives the reason for it on a line that starts with "Why". "Recommended" gives what the explanation framework says about it, including its priority tier. "Source" shows the quotations from your page. "Next steps" lists the tasks linked to the concept; select one to open it in the list, or select "Show the 2 tasks in the list ↓". The same tasks get a ring in the list. "Connections" lists the concept's connections; select one to open it.
A selected connection shows each relationship record between the two concepts, marked "Observed · explicit" (the page states it), "Observed · inferred" (the analysis inferred it from the page) or "Suggested relationship" (the explanation framework suggests it). Under "Source", the detail says "No edge-specific quotation was recorded. Concept quotations do not verify this connection." The quotations of the two concepts do not prove that the page states the connection. The tasks listed under a connection concern the connected concepts; they do not verify the relationship.
How do I move around the map?
The controls above the map change only the view. They do not change the report. A client link shows the map and its key without these controls, without "Export PNG" and without the hint in the legend.
You can also drag the map to move it. The legend gives the keyboard and pointer hints: "Drag to move · + / − to zoom · 0 to fit · Ctrl / ⌘ + wheel to zoom". With the map in focus, press Escape to clear the selection and return to the page overview. Escape also closes the expanded map.
| Control | What it does |
|---|---|
| Fit whole map | Fits the whole map into the visible area. |
| Read labels | Zooms to 100% around the selected concept, or around the topic of the page when nothing is selected. It is not available when the map is already at 100%. |
| − and + | Zoom out and zoom in. The figure between them is the current zoom. |
| Expand map | Shows the map over the whole window. Select "Close expanded map" to return. |
| Export PNG | Saves the map as an image, with a short key to the marks and a list of the relationship records. |
Can I read the map as a list?
Yes. The section "Map inventory", under the next steps, lists every concept with its state, and every relationship record with its direction and whether it was observed or suggested. Its heading line counts them, for example "12 concepts · 15 relationship records".
On the dashboard and on a shared link, select "Read concepts & connections" to open the list, and "Hide readable inventory" to close it. A client link shows the list without a click.
When a map is too large to draw, the report says "This map is too large to draw interactively." and shows the list without a click, so that you can still read every concept and connection.
Related topics