Coverage Score
How the score is computed from integration quality and depth-weighted question coverage, and what it does not measure.
What the score measures
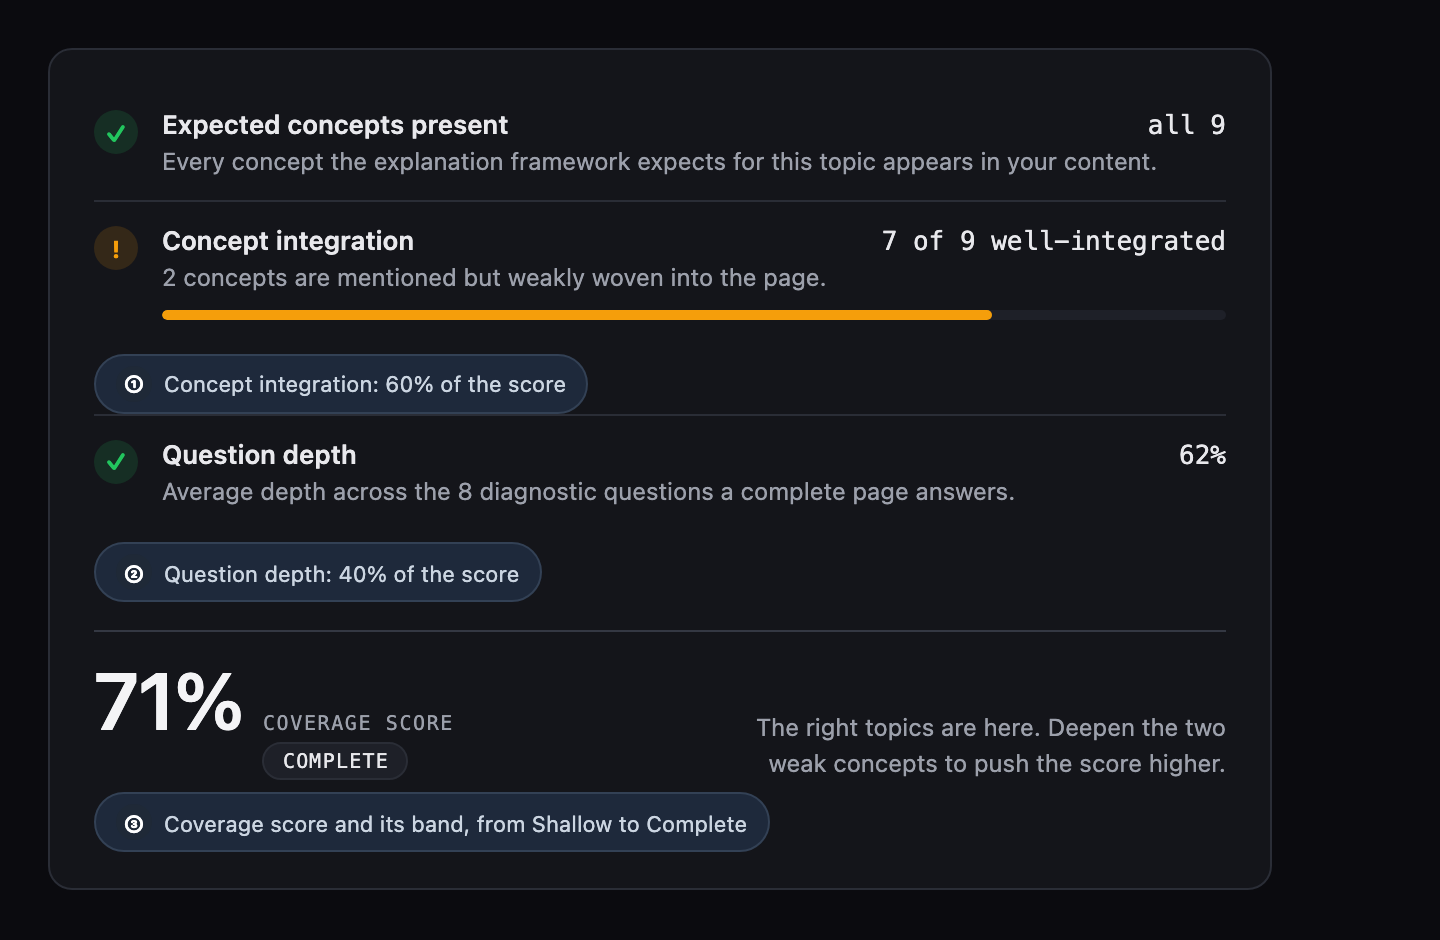
The coverage score is a composite measure of how well your content is structured for the topic ContentGrapher detected. It has two components.
The first component (60% of the score) measures concept integration quality: the ratio of your observed concepts that are fully integrated — well explained, consistently named, and connected to related ideas — to the total number of concepts ContentGrapher identified in your content.
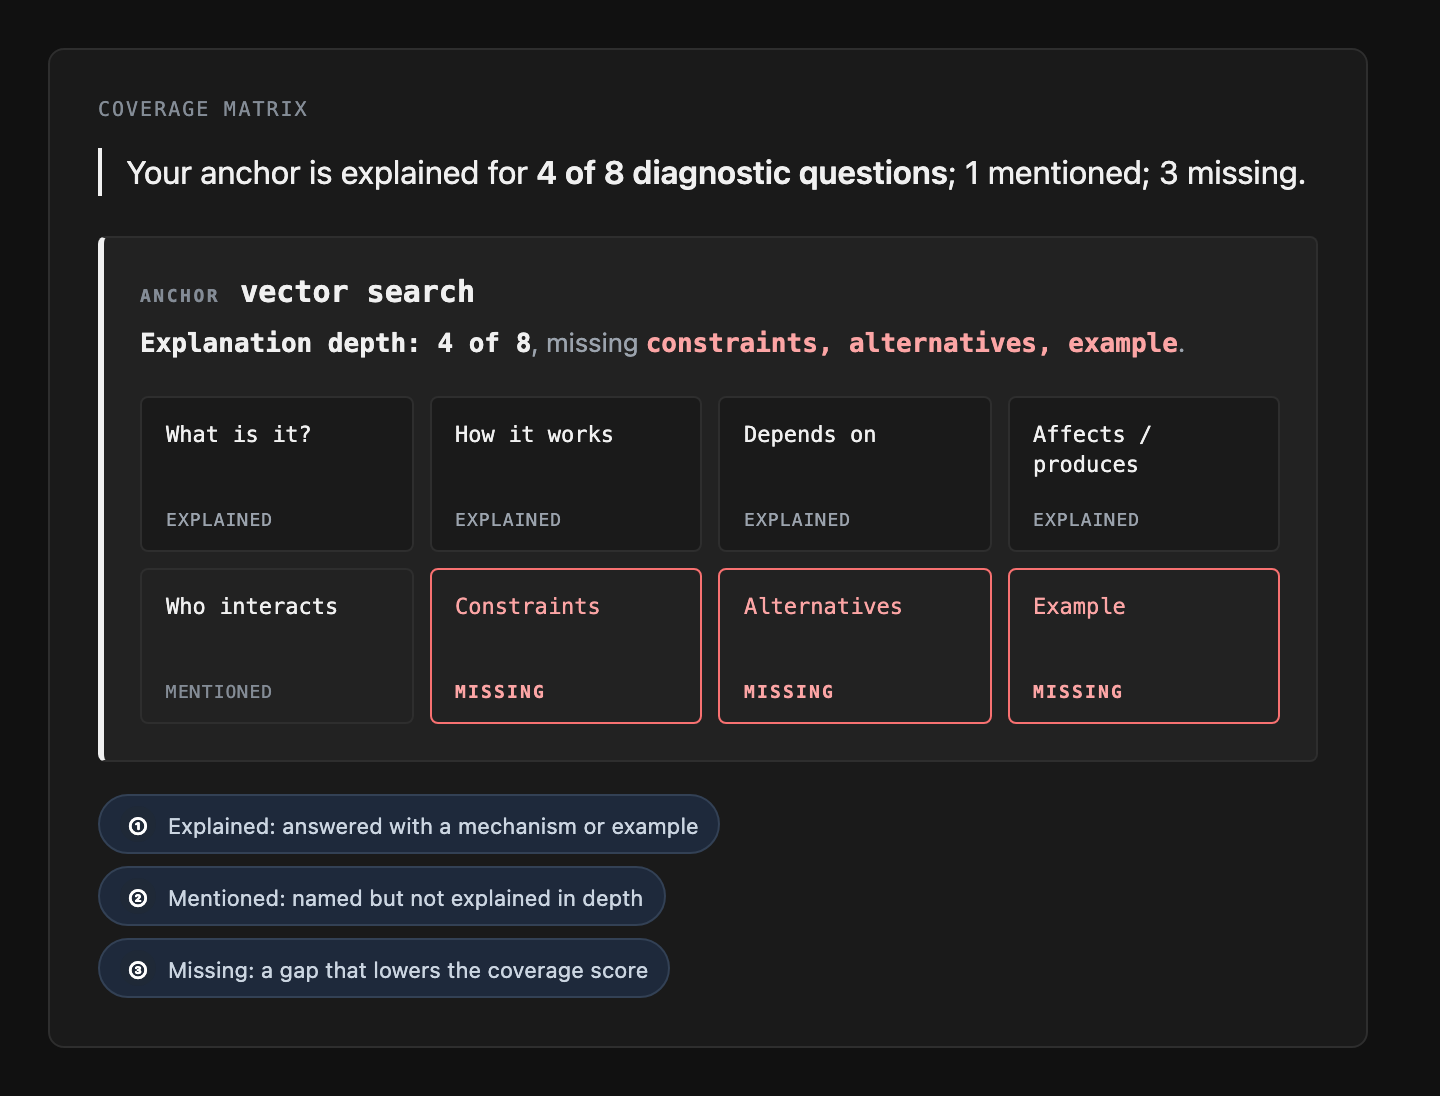
The second component (40% of the score) measures diagnostic question coverage. ContentGrapher asks 8 structural questions about your primary topic: what the topic is, how it works, what it depends on, what it produces, who interacts with it, what its constraints are, what alternatives exist, and what a grounding example looks like. Each question is rated on a four-level depth scale: not addressed, mentioned in passing, explained with a mechanism, or grounded with a worked example or named entity. Each rating is then refined by signals in the relevant passage of your content: whether the answer has enough length to develop, whether it includes a worked example, and whether it names concrete entities. The 8 refined ratings combine to produce this component, giving the score finer resolution than a simple count of covered questions.
These two components normally blend in this 60/40 ratio. If question depth could not be scored for an analysis — for example, an older analysis whose source page can no longer be re-fetched — the depth step reads "not scored" and the coverage score reflects concept integration alone. Re-analyzing the page adds depth scoring and restores the full blend.
A score of 74% means your content's combination of integration quality and depth-weighted question coverage reaches 74% of the maximum on these two dimensions.
What the score band means
Alongside the percentage, ContentGrapher shows a one-word band that places the score on a four-step scale. The band is a faster read than the raw number: it tells you which tier of structural completeness the page currently sits in.
Complete (70% and above): the expected concepts are present and explained at depth. Solid (55 to 69%): strong coverage, with room to deepen a few areas. Developing (35 to 54%): the core is forming, but several concepts are thin or missing. Shallow (below 35%): significant structural gaps remain.
Treat the band as a checkpoint, not a target. Use the writing brief to move up a tier, and track the percentage across re-analyses in the delta view to confirm a revision registered.
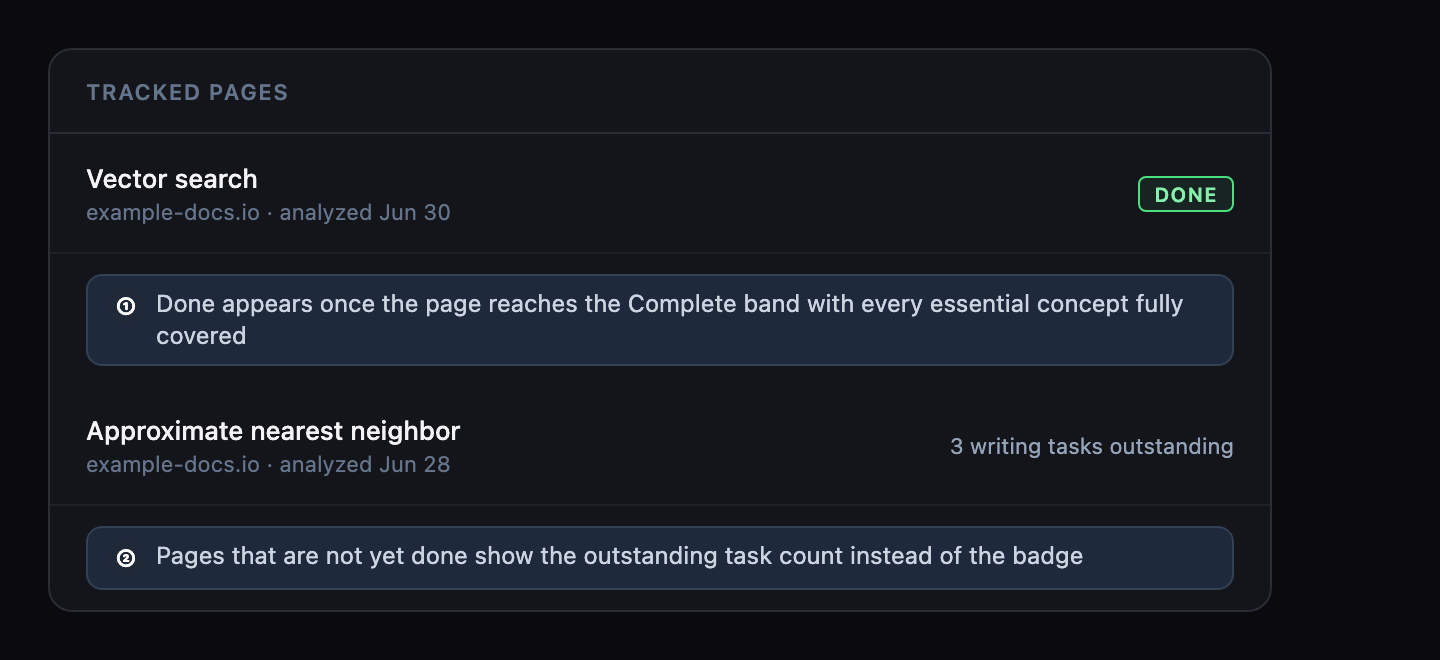
Reaching the Complete band by itself is not enough for ContentGrapher to mark a page done. Done additionally requires every concept classified as essential in the explanation framework to be fully covered, not merely partial or missing, and that the page architecture recommendation is not to split the page into multiple pages. When all three hold, ContentGrapher marks the page done: a "Done" badge appears next to it in your dashboard, and the writing brief opens with confirmation that no further changes are needed. See Writing Brief for what changes on a done page.
Once a page is marked done, a small dip on a later re-analysis does not immediately undo that status. Done only reverts on a clear regression: the score falling well below the Complete threshold, or an essential concept becoming missing again. This keeps the done status stable against the kind of small run-to-run noise described in the delta view, rather than flickering on and off between analyses.
The explanation framework is a separate measure
In Phase 2, ContentGrapher also builds an explanation framework for your topic and audience: the complete set of concepts that should exist on a page like this, with each concept classified as essential, important, or useful. This framework is what generates the writing brief — the gap between what you have and what should be there.
The explanation framework gap is displayed in the writing brief sections ("What to add", "What to clarify", "Relationships to make explicit"). It is a different measure from the coverage score.
The coverage score reflects the structural quality of what is already in your content. The framework gap reflects what is missing compared to an ideal page for your specific topic and audience. The score tells you where you are. The writing brief tells you what to do next.
How integration state and question coverage work
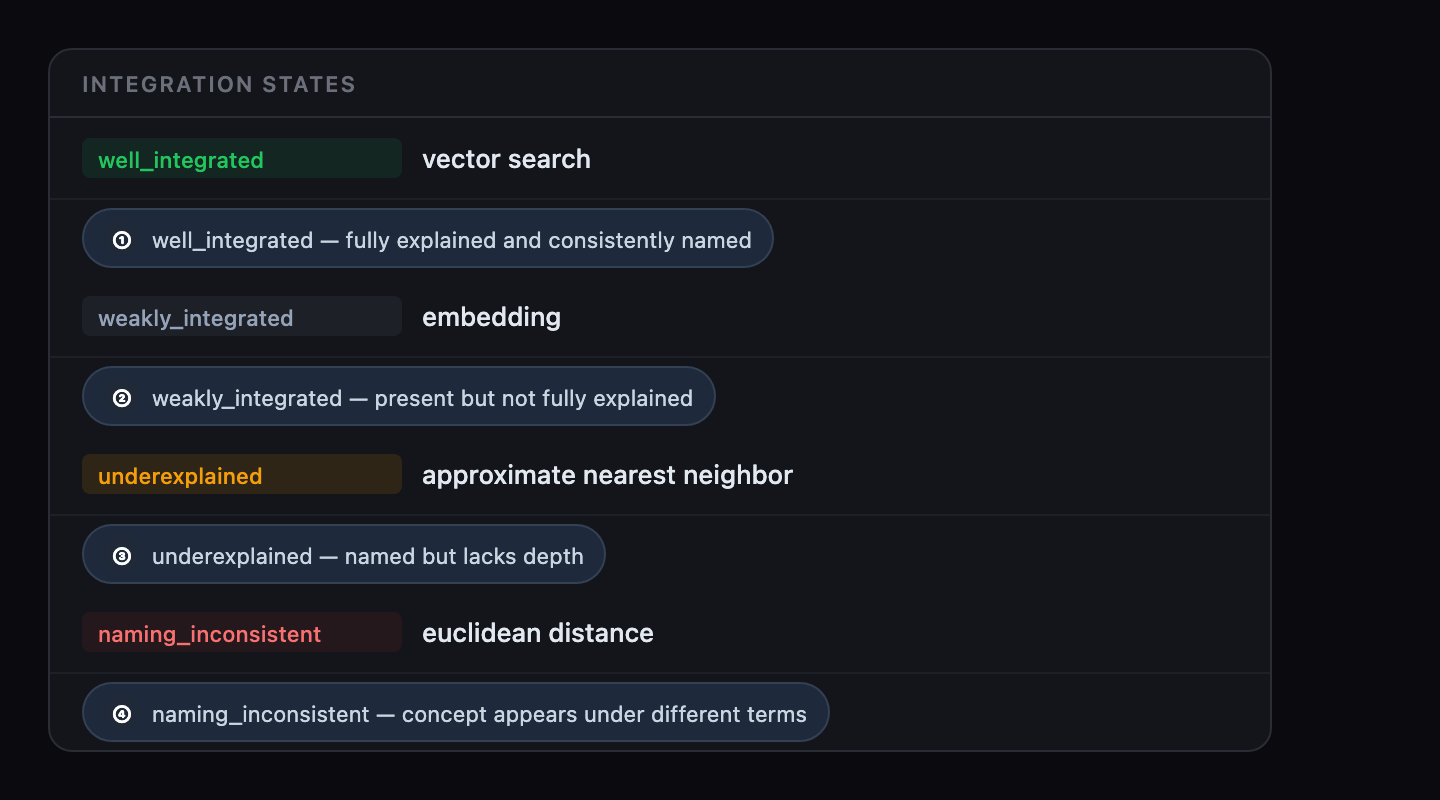
A concept is well_integrated when it is named consistently, explained at sufficient depth, and connected to related concepts explicitly. Three other states indicate partial or incomplete coverage: weakly_integrated (present but not fully explained), underexplained (named but lacks depth), and naming_inconsistent (the concept appears under different terms across the page).
Only well_integrated concepts contribute to the 60% integration component of the score. The 40% question coverage component is independent: it measures how thoroughly your content addresses the 8 diagnostic questions about your primary topic, with each question rated for depth on a four-level scale, regardless of how many total concepts you have.
What the score does not measure
The coverage score is not an SEO score. It does not measure keyword frequency, readability, word count, or competitor alignment.
It does not measure whether your content is accurate, engaging, or well-written. You can reach a high score with technically correct but poorly written prose.
It does not benchmark against other pages. ContentGrapher derives its analysis from your topic and audience, not from what currently ranks.
A score of 100% means structural completeness as ContentGrapher's model defines it for this topic and audience. It does not guarantee citation — domain authority, publication, and indexing are outside the model.
How to use the score
Use it directionally, not as a target. The goal is not 100% — it is a measurable improvement in the gaps that matter most for your audience.
Track the score across re-analyses using the delta view. A score that improves after addressing the top writing brief items confirms the revisions addressed real structural gaps. A score that stays flat means the revisions did not address the gaps ContentGrapher identified — go back to the "What to add" section first.
The guidance to start with flagged gaps is grounded in the Decoy Study, ContentGrapher's published controlled test across 40 third-party pages. In that study, on pages with five or more flagged gaps, filling the flagged gaps improved AI retrieval by 11 percentage points more than adding the same amount of content to parts the analysis said were already fine. Those figures are specific to the study's pages and retrieval setup; the size of the effect on your page will differ.
The gap count itself is part of the signal. The Decoy Study found that when a page has five or more flagged gaps, addressing the specific gaps identified made a measurable difference: targeted additions outperformed untargeted structural additions by 11 percentage points on the study's retrieval measure. When a page has two or fewer flagged gaps, the study found no meaningful difference between addressing flagged gaps and adding content to areas the analysis said were already fine. Those figures are specific to that study's pages and retrieval setup; the effect on your page will differ.
Related topics