Coverage Score Is Now Depth-Sensitive
You can now trust that a higher coverage score means deeper, more useful content — not just more of it. The scoring instrument was rebuilt to separate shallow mentions from substantive coverage, giving you a signal that moves when your writing actually improves.
Problem
Context
Why now
What changed
Coverage scoring now requires genuine depth, not just presence. A question is only counted as covered if the content actually explains it — a passing mention no longer qualifies. The same 14 pages that produced 2 distinct score values before now produce 14. The instrument can now tell a thin FAQ from a deep technical guide.
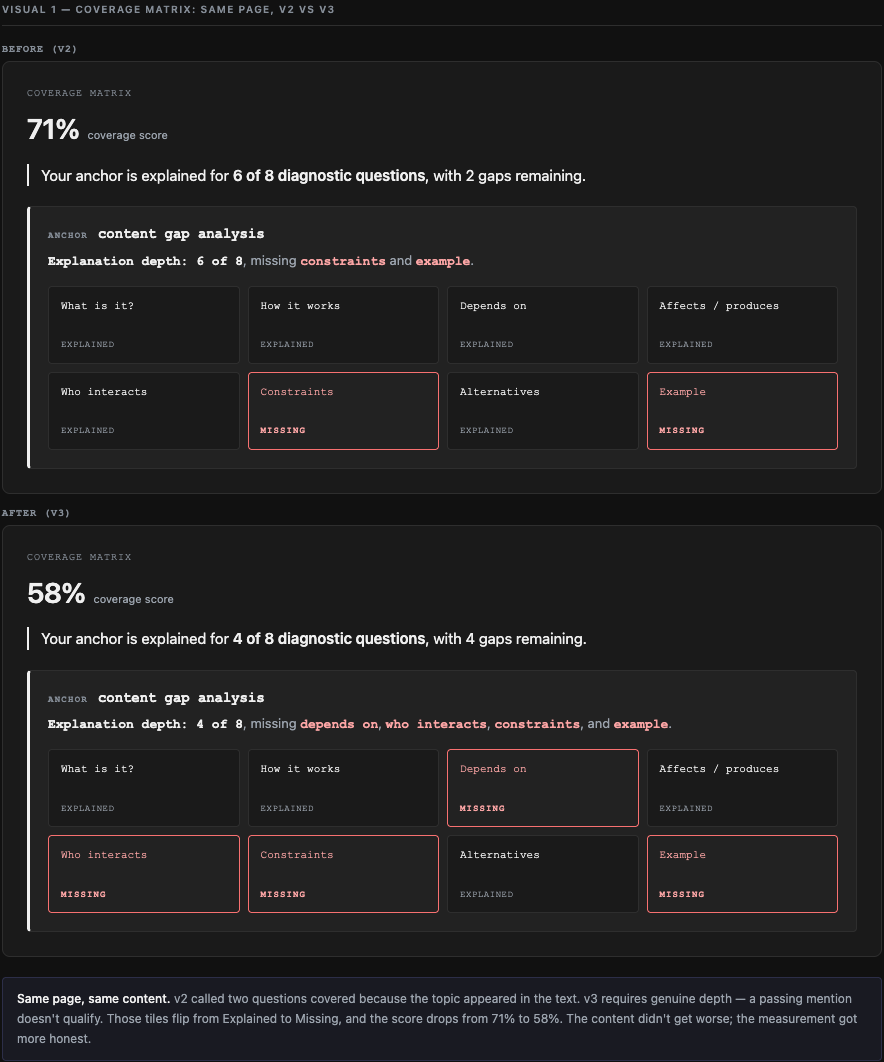
The example above shows the same page under both scoring versions. v2 called 6 of 8 questions covered and scored the page 71%. v3 found that two of those — Depends on and Who interacts — were only mentioned in passing. They flip to Missing, and the score drops to 58%. Same content, more honest measurement.
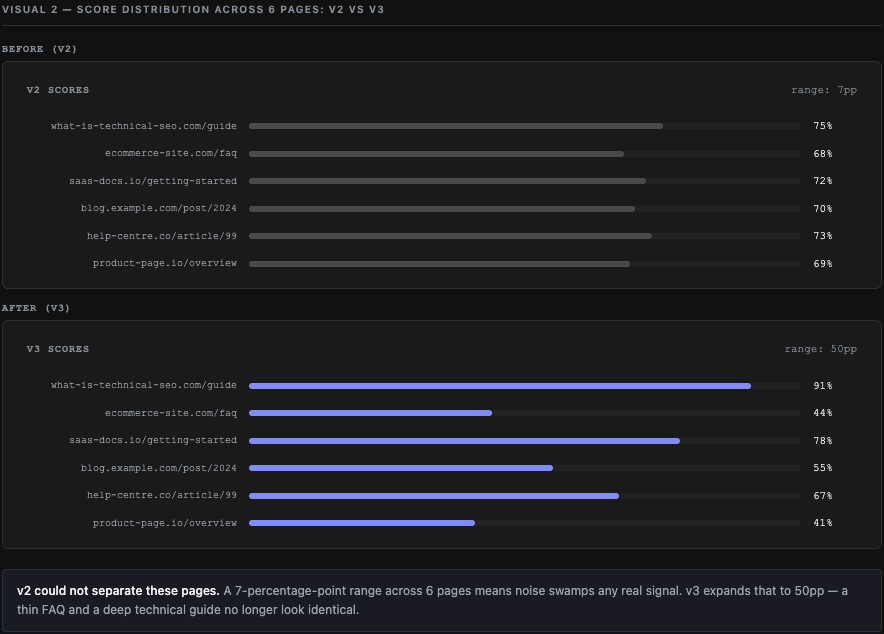
Across a set of pages, the difference is even clearer. v2 compressed everything into a 7-point band — noise larger than signal. v3 spreads the same pages across a 50-point range. Pages with genuinely thin coverage now score in the 40s; pages with thorough, well-structured explanations reach the 80s and 90s.
Scores will look lower than before on most pages. This is expected — v2 was inflated by counting mentions as coverage. A score of 65% under v3 reflects a more honest read of what a retrieval system would actually find useful. If you re-analyse a page that was last analysed before 8 June 2026, the numbers are not directly comparable; the dashboard will flag this when a series crosses the scoring version boundary.